· 26 min read
Complete Guide to Reverse Osmosis Membrane Replacement: Optimization Strategies for Water Treatment Plants
Learn when to replace RO membranes, how to extend lifespan, and use AI-powered optimization to reduce replacement costs and improve plant efficiency.
Complete Guide to Reverse Osmosis Membrane Replacement: Optimization Strategies for Water Treatment Plants
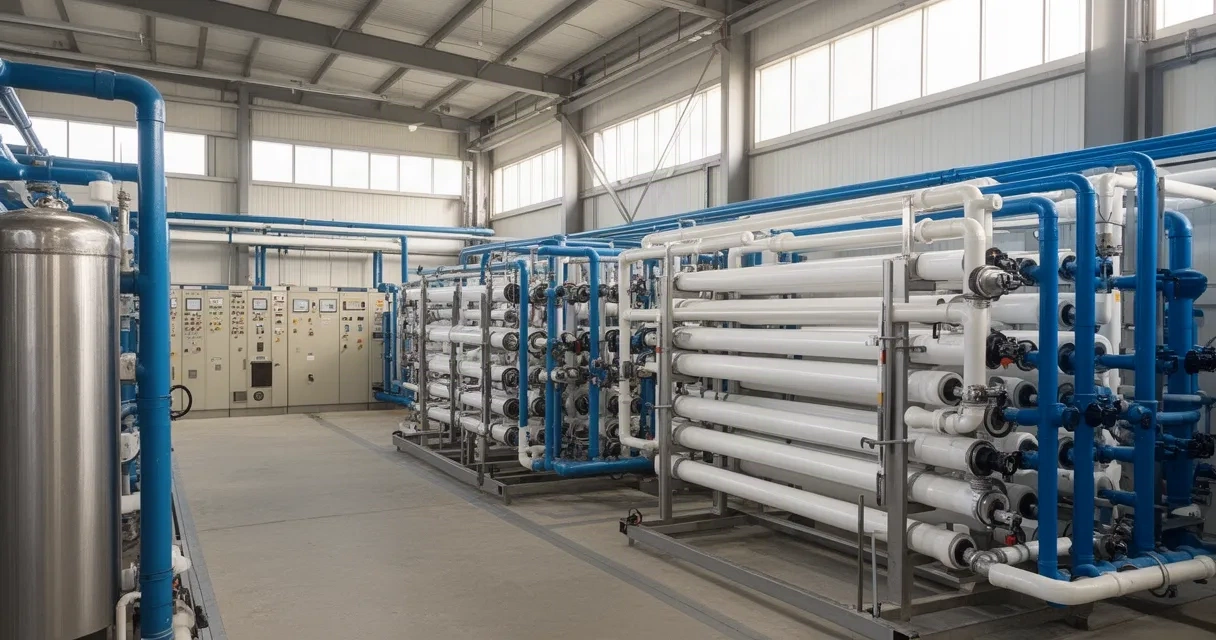
Reverse osmosis membranes are the backbone of modern water purification systems, yet they represent one of the most significant operational expenses for water treatment facilities. Whether you operate a commercial desalination plant, industrial water reuse system, or municipal treatment facility, understanding reverse osmosis membrane replacement is critical to maintaining efficiency, controlling costs, and ensuring consistent water quality.
The challenge facing plant managers today is multifaceted: membranes degrade unpredictably, replacement timing affects both budget and performance, and premature failure can cascade through your entire system. Traditional maintenance approaches rely on reactive replacement schedules or conservative estimates, often leading to either unnecessary spending or unexpected system failures.
This comprehensive guide explores the modern approach to reverse osmosis membrane management. We’ll examine the science behind membrane degradation, proven operational strategies to extend membrane lifespan, emerging AI-powered optimization techniques, and practical frameworks for budget planning. By the end, you’ll have a complete operational toolkit for transforming your RO system from a cost center into an optimized, predictable investment.
When to Replace Your Reverse Osmosis Membrane: Performance Indicators
Determining the right replacement timing separates effective water treatment operations from costly, inefficient ones. Rather than relying on calendar-based schedules, modern facilities monitor specific performance metrics that indicate declining membrane function.
Understanding Performance Degradation Patterns
RO membranes follow predictable degradation curves. Initially, they operate at peak efficiency—removing contaminants at design specifications while maintaining target flow rates. Over time, three primary indicators signal declining performance:
Feed water pressure requirements increase as membranes become blocked with accumulated solids, minerals, and biological matter. If your system required 200 psi during initial operation and now needs 250+ psi to maintain the same water output, your membrane is accumulating foulants.
Product water quality declines as membrane surface damage develops microscopic tears and defects. You’ll notice rejected total dissolved solids (TDS) levels rising, or specific contaminant levels increasing. For systems requiring ultra-high purity water, even small increases in conductivity may trigger replacement needs.
Recovery rate (permeate flow) decreases despite maintaining operating pressure. This indicates physical membrane deterioration rather than surface fouling. If your system historically produced 70% recovery and now achieves only 55% at identical settings, structural membrane damage has likely progressed significantly.
Monitoring Critical Metrics
The most reliable replacement decisions rely on continuous measurement of four key parameters:
Normalized flux (NF) measures water passing through the membrane adjusted for temperature variations. A decline of 15-20% from baseline indicates fouling; beyond 25-30% suggests replacement timing. Normalized flux accounts for the fact that colder water moves more slowly through membranes, preventing false alarms during seasonal temperature changes.
Salt passage or differential rejection reveals membrane integrity. When a membrane consistently removes 99.5% of dissolved salts and suddenly drops to 98%, this 1.5% change signals mechanical defects. For high-purity applications, maintaining rejection above 99% is often the critical threshold.
Differential pressure across stages shows where fouling concentrates. If your first-stage pressure drop increases 40% while later stages remain stable, the first membrane bears higher contaminant loading and may need earlier replacement.
Silt density index (SDI) of feed water and system performance correlation helps predict membrane lifespan. Feed water with SDI above 5 dramatically accelerates membrane fouling and shortens replacement intervals from typical 5-7 years to 2-3 years.
Recognizing Premature Failure Signs
Certain conditions demand immediate replacement before standard performance indicators might suggest it:
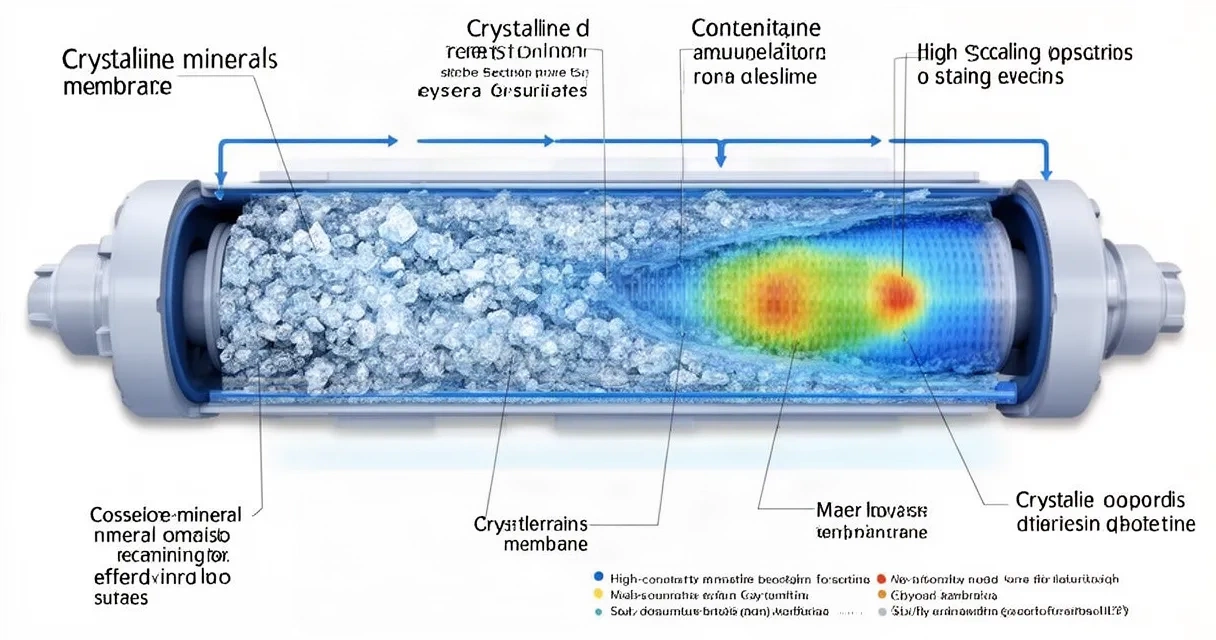
- Visible salt precipitation or crystalline deposits on membrane surfaces
- Sudden, unexplained pressure spikes across single stages
- Biofouling indicators (bacterial slime visible on cartridge housings or strange odors)
- Brown or discolored permeate water despite normal pressure readings
- Membrane channeling (water bypassing certain membrane sections)
These conditions indicate replacement timing has arrived, regardless of calendar age or routine metrics.
Extending Membrane Lifespan: Operational Best Practices
The most cost-effective reverse osmosis membrane strategy involves maximizing the useful life of installed membranes through disciplined operational practices. Most membrane degradation is preventable through proper maintenance and system management.
Pre-treatment: The Foundation of Membrane Protection
Your feed water quality directly determines membrane replacement frequency. Systems receiving inadequately treated water experience catastrophic lifespan reduction—sometimes cutting expected membrane life in half or more.
Effective pre-filtration removes particulate matter, sediment, and suspended solids before they reach RO membranes. Multimedia filters (sand, anthracite, gravel layers) reduce suspended solids to less than 1 micron. Adding cartridge filters after multimedia filtration further polishes feed water, ideally achieving 5-micron or better particulate removal. This simple two-stage pre-filtration approach can extend membrane life by 40-60% alone.
Chemical pre-treatment addresses dissolved contaminants that cause scaling and chemical attack. Softening systems remove calcium and magnesium ions that precipitate on hot membrane surfaces. Scale inhibitors (phosphonates, polymeric inhibitors) prevent mineral deposits even at high saturation levels. When feed water contains hydrogen sulfide, iron, or other oxidizing compounds, appropriate chemical adjustment prevents oxidative membrane damage.
Active carbon filtration removes chlorine, chloramine, and other oxidizing biocides. This single step is non-negotiable—even small chlorine residuals in feed water chemically degrade RO membranes, causing irreversible damage within hours. Many plant failures stem from chlorine breakthrough in carbon filters going undetected. Continuous residual chlorine monitoring ensures carbon effectiveness.
Biological management prevents biofouling, arguably the most common cause of premature membrane replacement. Biofilm formation accelerates dramatically once bacteria establish on membrane surfaces, consuming available nutrients and creating acidic microenvironments that accelerate membrane degradation. Periodic biocides (approved non-oxidizing biocides like sodium bisulfite combined with specific bacteriostatic compounds) interrupt biofilm formation. Maintaining system cleanliness and minimizing stagnant water zones reduces biofilm risk significantly.
Operational Discipline and Maintenance Protocol
Even excellent pre-treatment requires operational consistency to protect membrane investment.
Maintain stable operating conditions. Membranes tolerate modest pressure variations, but extreme swings accelerate degradation. Design systems with appropriate pressure relief valves, check valves, and backpressure regulators that prevent pressure spikes exceeding 25% of normal operating specifications. Avoid aggressive pressure increases attempting to compensate for fouled membranes—instead, clean membranes before pressure exceeds design limits.
Implement regular cleaning schedules before emergency conditions develop. Waiting until rejection drops 5-10% before cleaning guarantees extensive biofilm and scaling establishment. Instead, schedule maintenance cleaning every 6-12 months (or quarterly in challenging feed water conditions). Cleaning removes foulants while they’re still reversible, preventing permanent membrane surface damage.
Use proper cleaning chemistry matched to your specific foulants. Generic alkaline cleaners suffice for organic and biological fouling, but scaling requires specific acid sequences. Iron-containing feeds need chelating agents. Biological fouling may require enzymatic cleaners combined with biocides. Incorrect cleaning chemistry sometimes damages membranes as severely as improper feed water quality.
Monitor and maintain system temperature within specifications. Most RO membranes operate optimally between 25-30°C. Operating consistently above 35°C dramatically shortens lifespan. When seasonal temperatures exceed safe levels, consider system shutdown during peak heat or installing heat exchangers to cool feed water.
Prevent dry operation and air intrusion. Membranes exposed to air oxidize and lose performance irreversibly. Always maintain system pressure above atmospheric levels. When shutting down for extended periods, preserve membranes in biocide solution (sodium bisulfite or approved preservatives) rather than leaving them dry.
Documentation and Trend Analysis
Systematic recording of operating parameters reveals degradation trends before they become crises. Facilities implementing computerized system monitoring detect performance decline 3-6 months earlier than those relying on periodic manual readings.
Record daily: inlet pressure, outlet pressures (concentrate and permeate), flow rates, temperature, and permeate water quality (conductivity/TDS). Monthly, calculate normalized flux and salt passage. Quarterly, review trends to predict cleaning needs and replacement timing.
This data foundation is essential for the next phase of optimization: AI-powered predictive maintenance.
AI-Powered Membrane Optimization: Reducing Replacement Frequency
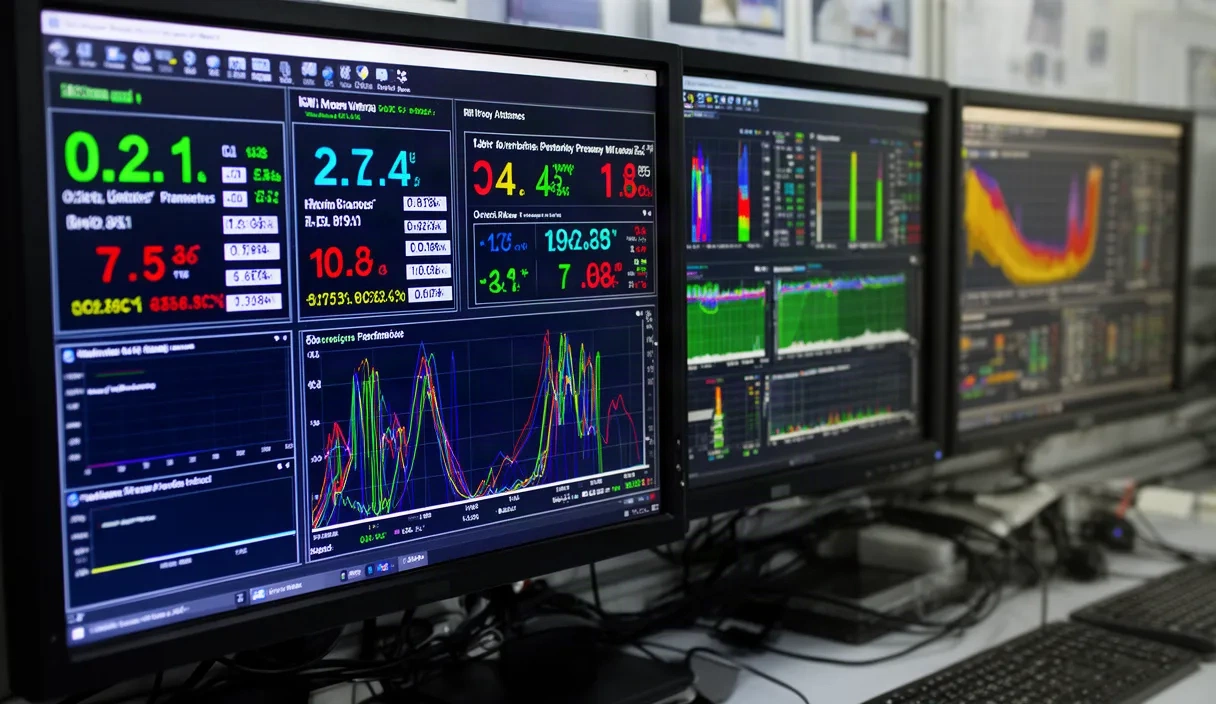
Artificial intelligence transforms reverse osmosis membrane management from reactive guesswork into predictive science. Modern AI systems analyze complex operating patterns that human operators cannot track manually, predicting optimal replacement timing with remarkable accuracy.
How Machine Learning Predicts Membrane Performance
AI algorithms trained on thousands of RO system datasets recognize degradation patterns invisible in raw data. These systems correlate multiple variables simultaneously—feed water chemistry, operating pressures, temperature changes, seasonal patterns, cleaning effectiveness, and historical replacement frequency—to predict remaining useful membrane life.
The advantage over traditional monitoring: AI captures non-linear relationships. For example, an AI system might recognize that during winter months, your specific feed water source creates a particular fouling pattern that accelerates between months 18-26 of membrane operation, making replacement timing during month 24 optimal for your system. A human operator using calendar schedules would either replace too early or too late.
Detecting Foulant Type and Severity
Advanced AI systems classify fouling types based on pressure response patterns and water quality metrics:
- Organic fouling creates gradual, consistent flux decline with modest pressure increase
- Scaling produces rapid, localized pressure spikes in specific stages
- Biofouling shows characteristic patterns: initial stability followed by sudden performance collapse
- Particulate fouling causes proportional pressure increases across all stages
By identifying specific foulant types, AI recommends targeted interventions. Organic fouling requires alkaline cleaning; scaling demands acid treatment; biofouling needs biocide intervention. This specificity prevents unnecessary cleaning cycles and chemical waste while optimizing actual foulant removal.
Optimizing Operating Parameters in Real-Time
AI systems don’t just predict replacement timing—they actively manage system operation to extend membrane life. These optimization engines adjust operating parameters continuously:
Adaptive pressure management maintains membranes below stress thresholds while maximizing recovery. As membranes age, AI gradually increases pressure just enough to maintain target flow, but never exceeding design limits. This maintains system output while minimizing accelerating damage from high pressure operation.
Intelligent recovery rate optimization balances production against membrane stress. Higher recovery rates strain membranes more intensely, accelerating degradation. AI systems determine optimal recovery for each system’s specific situation—sometimes operating at 65% recovery with longer membrane life exceeds the economic benefit of 75% recovery with reduced lifespan.
Predictive cleaning scheduling recommends cleaning intervals before foulants cause permanent damage. Rather than scheduled cleaning regardless of actual need, AI analyzes degradation trajectory and recommends cleaning when foulant reversal is still possible. This prevents both unnecessary cleaning and damage from delayed cleaning.
Energy Consumption Optimization
Reverse osmosis costs extend beyond membrane purchase and labor—energy consumption during operation often exceeds hardware costs over system lifetime. AI optimization reduces energy substantially:
When membranes foul, maintaining target output requires higher operating pressures, which demand greater energy input from high-pressure pumps. AI detects fouling before it becomes severe and recommends cleaning, maintaining lower operating pressures. This dual benefit—extended membrane life and reduced energy—makes AI optimization economically compelling.
Some advanced systems predict seasonal water quality changes months in advance and recommend adjusted pre-treatment strategies during vulnerable periods, preventing fouling rather than treating fouling after it occurs.
Implementation Considerations
Deploying AI optimization requires system integration: real-time sensor data feeds into analysis engines, which generate recommendations displayed to operators or automatically control valve positions and pump speeds in fully automated systems.
Success depends on data quality. Systems with poor sensor maintenance, calibration drift, or unreliable instrumentation provide garbage data that AI cannot improve. Ensure sensors are calibrated monthly and data validation checks identify and flag anomalies automatically.
Training operator teams on AI recommendations is critical. When AI suggests actions contradicting operator experience or conventional wisdom, understanding the reasoning increases acceptance and compliance. Most facilities find AI recommendations align with operator intuition but with precision and timeliness operators cannot achieve manually.
Membrane Selection and Compatibility: Matching System Requirements
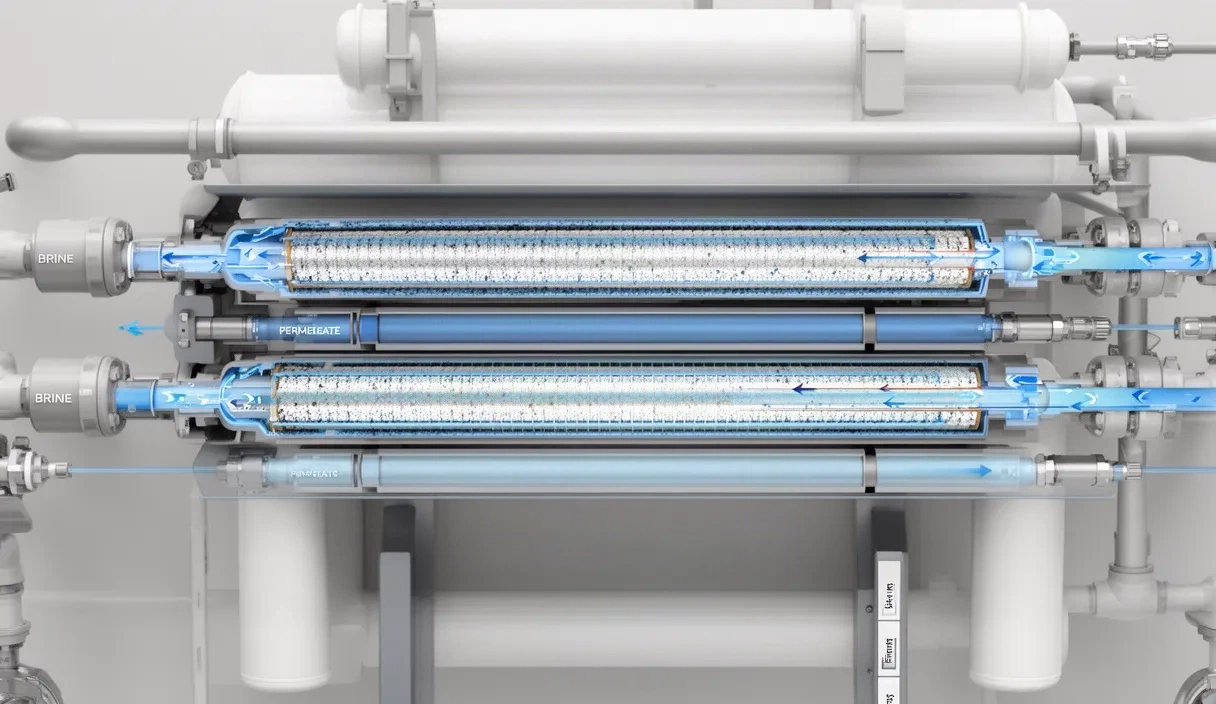
Not all reverse osmosis membrane solutions fit all systems. Selecting the correct membrane specifications for your specific application ensures both optimal performance and economical operation.
Understanding Membrane Material Specifications
Modern RO membranes are primarily thin-film composite (TFC) membranes—a polyamide active layer bonded to polysulfone or polyethersulfone support. Within this general category, membranes vary considerably:
Rejection rate (typically 95-99.5%) determines how effectively membranes remove dissolved solids. Higher rejection membranes produce purer water but operate at higher pressure and accept lower recovery rates. For applications requiring ultra-pure water (semiconductor manufacturing, pharmaceutical production), 99%+ rejection membranes are essential. For brackish water treatment, 96-98% rejection suffices.
Permeability or flux (measured in gallons per square foot per day—GFD) reflects membrane porosity. Higher flux membranes produce more water per unit area but are more prone to fouling and often have lower rejection. Lower flux membranes produce less water but tolerate challenging feed water better. Matching flux to your feed water quality is critical—high-flux membranes on dirty water fail rapidly; low-flux membranes in applications requiring high production are economically inefficient.
Operating pressure rating indicates maximum safe operating pressure. Most membranes are rated for 150-400 psi. Your system design must never exceed membrane specifications—exceeding ratings causes immediate damage. Conversely, operating well below rated pressures indicates over-sized membranes; downsizing to lower-rated (typically more economical) membranes might improve efficiency.
Temperature tolerance varies by polymer composition. Standard membranes operate safely to 45°C; heat-resistant membranes function to 50°C. Systems with high feed water temperatures require specification verification—improper selection leads to rapid failure regardless of other conditions.
Selecting Membranes for Your Feed Water
Membrane selection should match your specific feed water characteristics:
High-fouling feed water (high suspended solids, high organic content, high turbidity) benefits from low-flux, shorter element configuration. While these membranes produce less water per element, they tolerate fouling better and require less frequent replacement than higher-flux alternatives. When feed water SDI exceeds 3, low-flux membranes should be specified.
Low-fouling feed water (well-treated municipal water, low TDS sources) can utilize high-flux membranes economically. Higher production per element reduces hardware costs and energy consumption, offsetting slightly shorter useful life.
High-pressure applications (seawater desalination, ultra-high TDS water) require membranes specifically designed for high-pressure operation. Standard brackish water membranes cannot tolerate seawater application pressures; using them causes catastrophic failure.
High-temperature sources (thermal plant cooling water, geothermal sources, industrial process water) require heat-resistant membrane selection. Using standard membranes in high-temperature applications achieves only months of useful life instead of years.
Brackish Water Versus Seawater Membrane Differences
Brackish water membranes (rated for inlet TDS up to approximately 5,000 ppm) operate at 150-300 psi. They achieve 50-75% recovery rates. They’re ideal for well water, agricultural water, industrial process water treatment. Replacement membranes for brackish applications typically cost $300-800 per element depending on size and specifications.
Seawater membranes (rated for inlet TDS up to 40,000 ppm) require 800-1,200 psi operating pressures to overcome osmotic pressure. They achieve 25-50% recovery. Replacement membranes for seawater applications cost $1,200-3,000+ per element, with significantly higher energy requirements. System design and pre-treatment must be far more rigorous for seawater success.
Proprietary Versus Generic Membrane Considerations
Brand-name membranes from major manufacturers (Dow FilmTec, Hydranautics, LG Chem, Toray) typically cost 15-25% more than generic or lesser-known brands but offer documented performance history, consistent quality, and stronger technical support. For mission-critical applications or systems operating continuously, brand-name reliability often justifies cost premiums.
Generic membranes can perform excellently in stable operating conditions with good pre-treatment but provide less margin for error. In challenging situations, brand-name reliability advantages become economically significant.
Compatibility with Existing Housings
Membrane replacement requires ensuring physical and operational compatibility with existing pressure vessels and cartridge housings:
Element size (2.4” × 12”, 2.5” × 12”, 4” × 12”, 8” × 40”) must match housing specifications exactly. Installing incorrect sizes damages seals and causes bypass—contaminated water flows around membranes entirely, defeating purification.
Pressure rating of housings must meet or exceed membrane operating pressure plus cleaning pressure safety margins (typically 20-30% above normal operating pressure).
Port connections must be compatible. Incorrect connections cause leaks or channeling.
Most competent manufacturers ensure new membranes are compatible with standard housings and vessels, but verification before ordering prevents costly installation errors.
Cost Analysis: Budget Planning for Membrane Replacements
Reverse osmosis membrane replacement represents a substantial operational expense. Understanding cost structures and predictability enables strategic budgeting and investment evaluation.
Direct Replacement Costs
Membrane element costs vary significantly by type and source:
Brackish water membranes for small residential or light commercial systems range $150-400 per element. Standard commercial-grade brackish membranes cost $400-700. Large-capacity industrial brackish membranes exceed $800.
Seawater membranes start at $1,000 per element for standard specifications and exceed $2,500 for specialized high-pressure or high-temperature variants. An 8-stage seawater desalination system might use 40-80 elements, representing $40,000-200,000 in replacement membrane costs alone.
Labor costs for membrane replacement depend on system complexity and technician expertise. Simple cartridge-style systems require 2-4 hours per element (4-8 hours total for dual-membrane systems); labor costs $200-600 depending on regional rates and technician skill level. Complex RO units with multiple stages, skids, and instrumentation might require 16-40 hours for complete replacement, escalating labor costs to $1,000-3,000+.
Pre-replacement flushing, cleaning, leak testing, and system commissioning add another $300-1,500 depending on system complexity and testing requirements.
Total Replacement Cost Estimates for various system types:
A residential point-of-use system: $400-1,000 (membrane cost typically dominates) A light commercial 500-gallon-per-day system: $2,500-6,000 (membrane $1,500-2,500 + labor $1,000-3,500) An industrial 5,000-gallon-per-day system: $15,000-40,000 A municipal 100,000-gallon-per-day desalination facility: $200,000-500,000
Replacement Frequency Impact on Annual Costs
A membrane lasting 3 years versus 5 years represents a substantial cost difference over system lifetime:
A commercial system costing $20,000 to replace:
- 3-year replacement cycle: $20,000 ÷ 3 = $6,667 annual replacement cost
- 5-year replacement cycle: $20,000 ÷ 5 = $4,000 annual replacement cost
That $2,667 annual difference compounds over 20-year system lifetime ($53,340 total savings), rivaling or exceeding the entire system hardware cost. This reality transforms membrane lifespan from a maintenance detail into a critical business decision.
Extending average membrane life from 4 to 5.5 years through AI optimization and operational best practices delivers 37.5% reduction in replacement costs—economically equivalent to a 37.5% equipment discount.
Preventive Maintenance Cost-Benefit
Investment in preventive maintenance—higher-quality pre-treatment, regular cleaning, advanced monitoring—costs $2,000-5,000 annually for a moderate-sized system. If this investment extends membrane life by one year (from 4 years to 5 years), it saves $4,000-6,000 in replacement costs per cycle. The 2-3 year payback period makes preventive maintenance economically compelling for all but the smallest systems.
Budget Allocation Strategies
Facilities should allocate membrane replacement budgets using historic performance data and predictive models:
Conservative approach: Budget for replacement at current average lifespan (typically 4-5 years for brackish, 3-4 years for seawater). Many facilities set aside replacement costs monthly (e.g., $1,000-2,000/month for a system with $60,000 replacement cost anticipated in 5 years). This monthly funding approach spreads costs and prevents budget shocks.
Data-driven approach: Track individual system performance metrics; budget replacement timing based on degradation trajectory. A membrane showing rapid fouling might need replacement in 2 years; one showing excellent performance might reach 6 years. Customized budgeting reflects actual system behavior rather than generic averages.
Capital cost reduction strategies: Purchasing membrane elements in bulk for systems with multiple units often reduces per-element costs 10-15%. Negotiating service contracts with equipment vendors sometimes includes discounted replacement membranes. Some facilities participate in group purchasing through industry associations, achieving volume discounts.
Return on Investment for Optimization Systems
AI-powered monitoring and optimization systems typically cost $5,000-20,000 for initial setup plus $500-2,000 monthly service fees. The ROI calculation is straightforward:
If optimization extends average membrane life 6-12 months, it reduces replacement costs annually. For a system with $20,000 replacement costs every 4 years, extending life to 5 years saves $5,000 annually. This quickly recovers $10,000-50,000 investment costs, plus ongoing fees are exceeded by savings within 2-5 years.
For systems with multiple RO units or large industrial applications, ROI calculations are even more attractive. A municipal plant operating ten 100,000-gallon-per-day desalination units might save $100,000+ annually through optimization, making sophisticated monitoring systems financial no-brainers.
Environmental Impact: Sustainable Membrane Management
Reverse osmosis membrane replacement has substantial environmental implications often overlooked in operational cost analysis. Responsible membrane management aligns economic efficiency with environmental stewardship.
Membrane Production Environmental Footprint
Manufacturing RO membranes requires energy and generates waste. A typical RO membrane produces approximately 10-15 kilograms of CO2 equivalent during manufacturing (accounting for raw material extraction, polymerization, processing, and transportation). This embodied carbon is significant—for many systems, manufacturing membranes represents greater climate impact than operational energy consumption.
Extending membrane life by one year (20% reduction for a 5-year average) eliminates the manufacturing of 20% fewer replacement membranes. Over a 20-year system lifetime, this represents 4-5 fewer membrane manufacturing cycles—eliminating 40-75 kilograms of CO2 equivalent for a single system.
Brine Discharge and Waste Management
RO systems produce concentrated reject water (brine) containing removed contaminants. Disposing of this brine responsibly is an environmental and sometimes regulatory requirement.
Conventional brackish water RO systems achieve 50-75% recovery—meaning 25-50% of feed water becomes brine waste. A system producing 1,000 gallons per day of purified water generates 333-1,000 gallons of brine daily.
In fresh water applications, this brine typically contains dissolved minerals at 2-3 times feed water concentration. While not hazardous, large-volume discharge affects downstream water chemistry and salinity.
Advanced RO systems combined with secondary treatment (Zero Liquid Discharge or ZLD systems using evaporators, crystallizers, or further concentration) minimize brine waste. However, these systems consume substantial energy. Optimizing RO membrane performance through extended lifespan reduces overall system size needed, minimizing brine generation and treatment requirements.
Chemical Management and Cleaning Waste
Membrane cleaning uses acids, bases, and specialized detergents. A typical commercial membrane cleaning cycle consumes 50-100 gallons of cleaning solution. For industrial facilities, this translates to hundreds or thousands of gallons annually.
Cleaning solution waste disposal is regulated in many jurisdictions. Improper disposal causes environmental damage and regulatory violations. Optimizing cleaning intervals through AI-powered monitoring reduces unnecessary cleaning, cutting chemical consumption significantly—sometimes by 30-50% for systems with historically excessive cleaning.
Using environmentally benign cleaning chemicals (plant-based surfactants, biodegradable chelating agents) versus traditional industrial cleaners reduces environmental impact of waste streams. This shift sometimes costs slightly more per cleaning but aligns with corporate sustainability commitments.
Energy Consumption and Carbon Footprint
For most RO facilities, operational energy consumption dominates the system’s lifetime carbon footprint—often exceeding manufacturing and disposal impacts combined. A reverse osmosis system producing 1 million gallons daily might consume 80,000-150,000 kilowatt-hours monthly, generating 40-75 metric tons of CO2 monthly (depending on grid electricity source).
Extended membrane lifespan reduces energy consumption through several mechanisms:
First, newer membranes operate at lower pressure to achieve target flow. As membranes foul over time, pressure must increase to maintain output. Replacing fouled membranes with new ones restores lower-pressure operation, reducing energy substantially. AI-optimized systems extend membrane life while managing pressure increases more carefully, maintaining lower average pressure throughout system life.
Second, biofilm and scaling increase pressure requirements. Advanced fouling prevention maintains membranes cleaner, requiring lower operating pressure.
Third, removing membranes before they reach end-of-life (typically 5-10% of peak performance degradation) prevents the high-pressure, low-efficiency operation of failed or failing systems.
For a typical commercial system, optimizing membrane replacement can reduce energy consumption 10-20%, translating to $1,000-5,000 annual energy savings and 5-10 metric tons of annual CO2 reduction.
Circular Economy and Membrane Recycling
Modern RO membranes cannot be repaired or reconstituted once degraded. They must be discarded. However, responsible disposal includes recycling where possible:
- Polyamide active layers can be processed for chemical recovery or incineration with energy recovery
- Polysulfone support materials can be recycled into lower-grade plastics
- Metal hardware and housings are recyclable steel or aluminum
Currently, most spent RO membranes go to landfills because recycling infrastructure is limited and cost-prohibitive at small scales. Industrial-scale membrane recycling is emerging, but remains rare outside major metropolitan areas with advanced waste processing.
Facilities should investigate local recycling options. Some equipment vendors and recycling companies now accept spent membranes for proper processing. This requires minimal additional effort but substantially reduces environmental impact.
Sustainable System Design
From design phase, sustainable reverse osmosis begins:
- Oversizing systems is wasteful; accurately sizing systems to actual demand prevents years of excess capacity and associated waste
- Designing modular systems allows adding capacity without replacing functional components when demand increases
- Specifying durable housings and vessels rated for 20-30 year lifespan reduces hardware waste; membranes can be replaced while infrastructure persists
- Incorporating advanced monitoring enables extending membrane life and optimizing operations—the single most impactful sustainability action
Environmental management and economic optimization align remarkably well for RO systems. Actions extending membrane life, reducing energy consumption, and minimizing chemical waste also reduce operating costs and budget requirements.
Frequently Asked Questions
How often do reverse osmosis membranes typically need replacement?
Typical membrane replacement intervals vary by application. Brackish water systems serving municipal or industrial applications usually require replacement every 4-7 years, with 5 years as a reasonable average. Seawater desalination membranes typically require replacement every 2-5 years, with 3 years average. Small point-of-use residential membranes often last 2-3 years.
These averages mask significant variation. Feed water quality is the dominant factor—excellent pre-treated feed water allows membranes to last 7-10 years, while poor feed water quality can reduce lifespan to 2-3 years. Operating discipline matters enormously. Facilities that maintain lower operating pressures, prevent biofilm formation, and implement preventive maintenance achieve replacement intervals at the longer end of ranges. Conversely, facilities with high-pressure operation or insufficient pre-treatment face significantly shortened lifespans.
What is the typical cost of replacing an RO membrane in a commercial desalination system?
Direct replacement costs depend on system size and membrane type. For a brackish water system, individual membrane elements cost $300-800, and labor typically adds another $200-600 per element. A small commercial system with 2-3 membrane stages (4-6 elements total) might cost $2,000-5,000 to replace.
For large commercial systems, the calculation differs. A 5,000-gallon-per-day brackish system might use 12-20 elements; replacement costs approach $10,000-20,000. Industrial seawater desalination plants operating at 100,000+ gallons per day replacement costs can exceed $200,000-500,000 because they use many more high-cost seawater membranes.
Beyond direct costs, consider productivity loss during replacement downtime, system flushing and commissioning, and potential emergency replacement premiums if failure occurs without planning. Well-planned replacements during scheduled maintenance windows minimize total cost impact.
Can AI optimize my system to reduce membrane replacement frequency?
Yes, AI-powered optimization can extend membrane life through multiple mechanisms. First, intelligent pressure management maintains operating pressure as low as possible while achieving target water production, reducing membrane stress. Second, predictive cleaning scheduling recommends interventions before foulants cause irreversible damage. Third, real-time foulant identification enables targeted remediation rather than generic responses.
AI systems specifically designed for RO optimization typically extend average membrane life 10-25%, depending on baseline conditions and system complexity. For a system currently replacing membranes every 5 years, AI optimization extending life to 6-6.5 years represents substantial cost reduction over system lifetime.
Implementation requires real-time sensor data feeds, cloud-based analysis engines, and operator interfaces for recommendation display or automated controls for fully autonomous systems. Initial setup costs ($5,000-20,000) typically recover within 2-5 years for moderate-to-large systems.
What causes rapid membrane degradation and how do I prevent it?
Rapid membrane degradation stems from several causes:
Chlorine exposure is the single most common cause of premature failure. Even small chlorine residuals (0.1 ppm) cause irreversible oxidative damage within hours. Prevention requires active carbon filtration or dechlorination and continuous residual chlorine monitoring.
Biofouling accelerates degradation dramatically. Bacterial biofilms consume available nutrients while generating acidic metabolites that attack membrane polymers. Prevention requires biological management: periodic biocide treatment, minimizing stagnant water zones, and maintaining system cleanliness.
High-pressure operation beyond design specifications strains membrane polymers, causing mechanical fatigue failure. Never exceed membrane rated pressure. Relief valves and pressure regulators prevent accidental over-pressurization.
Chemical scaling from improper pre-treatment damages membranes chemically and physically. Using scale inhibitors and softening systems prevents mineral precipitation on membrane surfaces.
Incompatible cleaning chemicals sometimes damage membranes as severely as the foulants they address. Using appropriate cleaning chemistry for specific fouling types prevents collateral damage.
Dry storage or air exposure causes oxidative degradation. Always maintain system pressure above atmospheric levels; preserve membranes in biocide solution during extended shutdown periods.
Poor feed water quality overwhelms membranes with foulants faster than they can handle. Adequate pre-filtration and water treatment prevent premature failure.
Preventing rapid degradation requires vigilance: maintain excellent pre-treatment, monitor operating conditions continuously, implement regular preventive maintenance, and use proper cleaning chemistry.
How does membrane replacement impact energy consumption in a desalination plant?
Membrane replacement directly affects energy consumption through several mechanisms:
First, operational pressure changes with membrane age. A new membrane can achieve target water production at 200 psi. Over 5 years, the same membrane in identical conditions might require 280-320 psi to maintain output due to fouling and degradation. High-pressure pumps consuming 150 kilowatts at 200 psi consume 200-210 kilowatts at the elevated pressure, wasting 50-60 kilowatts continuously. Replacing with new membranes restores lower-pressure operation.
For a continuous 1,000-gallon-per-day system, this pressure increase represents roughly 5-10% energy penalty. Multiplied across the operating year, this translates to $3,000-8,000 additional annual electricity costs for a single system.
Second, membrane fouling increases energy consumption beyond pressure effects. Biofilm and scaling create additional flow resistance, requiring higher pressure for identical output.
Third, system-wide impact scales with facility size. A 100,000-gallon-per-day municipal desalination plant might waste $300,000-800,000 annually due to aged membranes operating at elevated pressure.
Strategic replacement scheduling before excessive pressure increases occur saves substantial energy costs. This economic reality makes membrane replacement timing decisions financial optimization problems, not simply maintenance chores.
What is the difference between membrane lifespan and effective service life?
These terms represent different concepts:
Membrane lifespan is the theoretical time a membrane can operate before complete failure—when it no longer functions at any performance level. A membrane’s actual lifespan depends heavily on operating conditions and can range from 2-10+ years.
Effective service life is the practical operating period during which a membrane delivers acceptable performance meeting system requirements. This is typically much shorter than theoretical lifespan.
For example, a membrane might technically function for 8 years before complete failure (its lifespan), but after 5 years, it might be producing water at 98% salt rejection when system requirements demand 99.5% rejection, or requiring 50% higher pressure to maintain output. At this point, effective service life has ended even though the membrane hasn’t completely failed.
Distinguishing these concepts prevents poor operational decisions. Some operators extend operations beyond effective service life to maximize hardware utilization, not recognizing that energy penalties, product quality issues, and system stress make continued operation uneconomical. Conversely, some operators replace membranes prematurely when they still deliver acceptable performance.
Optimal membrane replacement timing occurs near the end of effective service life, not when membranes completely fail. This maximizes membrane utilization while maintaining system efficiency and performance requirements.
Conclusion: Strategic Optimization of Reverse Osmosis Membrane Systems
Reverse osmosis membrane management separates efficient, profitable water treatment operations from those struggling with unexpected failures and escalating costs. The complete picture encompasses understanding when membranes require replacement, implementing operational practices that extend useful life, selecting appropriate membranes for your specific conditions, and budgeting strategically for predictable replacement cycles.
The convergence of several trends is transforming RO management from reactive maintenance into predictive optimization:
Advanced sensor technology enables real-time monitoring of system performance, providing accurate data on degradation rates. AI analysis of this data reveals degradation patterns and predicts replacement timing with remarkable accuracy. Operational best practices and improved pre-treatment technologies extend membrane lifespan consistently. Environmental awareness and sustainability requirements align perfectly with economic optimization—actions that reduce costs simultaneously reduce environmental impact.
For facility managers, the strategic imperative is clear: invest in understanding your specific system’s performance, implement disciplined operational protocols, and seriously evaluate AI-powered optimization systems. The payback period for these investments is typically 2-5 years, with ongoing benefits extending throughout system lifetime.
The facilities achieving the lowest replacement costs don’t achieve this through luck or generic best practices. They achieve it through systematic, data-driven approaches tailored to their specific feed water, operating conditions, and system constraints. They use advanced monitoring to catch problems early. They implement predictive maintenance before crises occur. They replace membranes at optimal timing—not too early and not too late.
Transform your RO system from a cost center into an optimized, predictable asset. The data to optimize your system exists right now in your sensors and operational records. Advanced analysis unlocks it, delivers actionable recommendations, and continuously improves your system’s economic performance.
The future of water treatment is optimized, predictive, and data-driven. Join facilities worldwide improving their reverse osmosis membrane operations through systematic, intelligent optimization.